SIPENELITIAN — Research Data Management System, Universitas Alma Ata
Research data management system for LP2M Universitas Alma Ata — from user interviews through to usability testing with 20 lecturers, scoring 76.75 on the System Usability Scale.
01. Project Overview
SIPENELITIAN is a research data management system for LP2M at Universitas Alma Ata. It handles the full flow — research proposals and internal grants, progress-report monitoring with logbooks, through to final reports and signed approval sheets — with two user roles: lecturer-researcher and LP2M admin.
02. Problem Statement
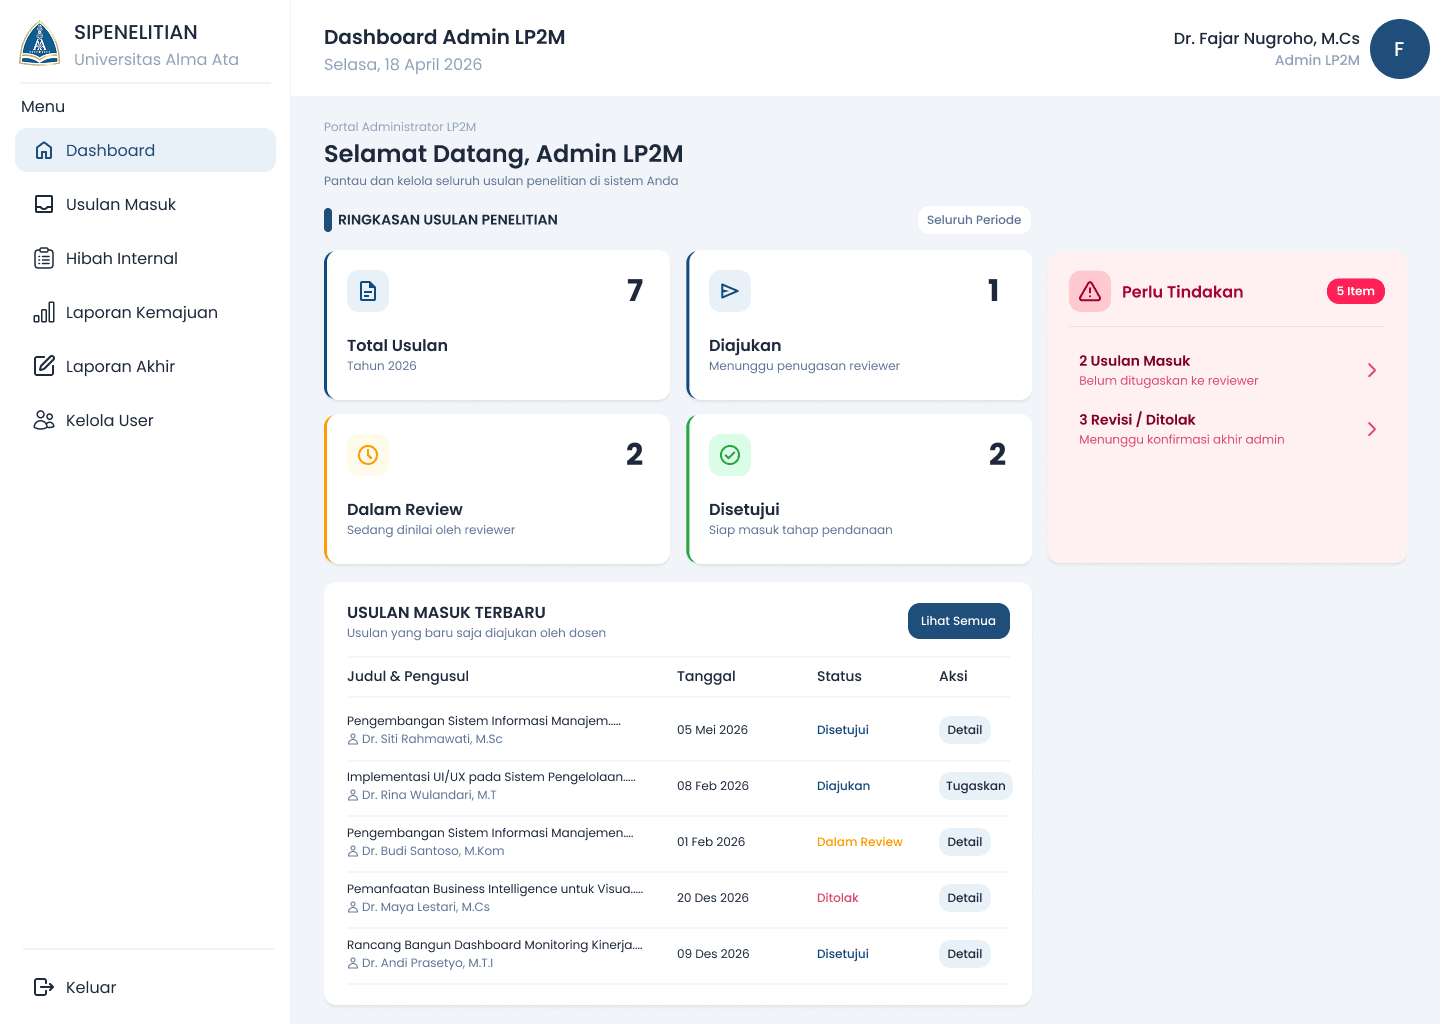
Research data scattered across many files made it hard for the LP2M admin to see where each proposal stood: which were still awaiting review, which were running, and which were late reporting progress. The design challenge was consolidating all of those states into a single interface without adding to the admin's workload.
03. User Research & Insights
The project followed a Design Thinking process, starting with interviews and observation inside the LP2M UAA environment to map the existing proposal and reporting flows, then translating that into an information architecture and a high-fidelity prototype.
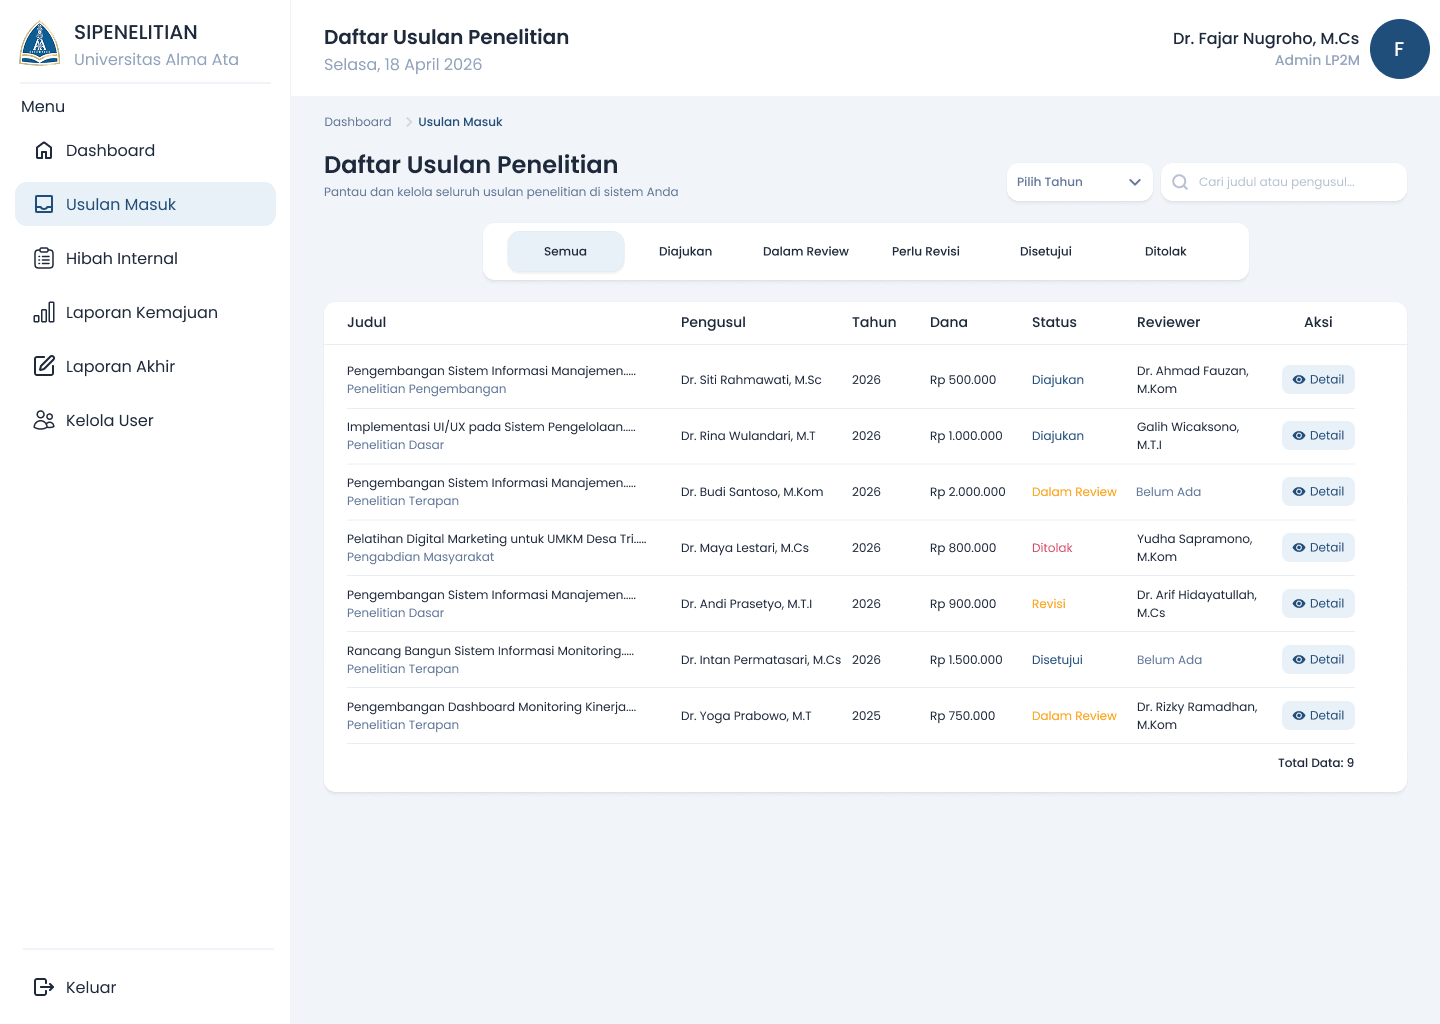
- The proposal list needs to show status and budget year together, so the admin can filter without opening documents one by one.
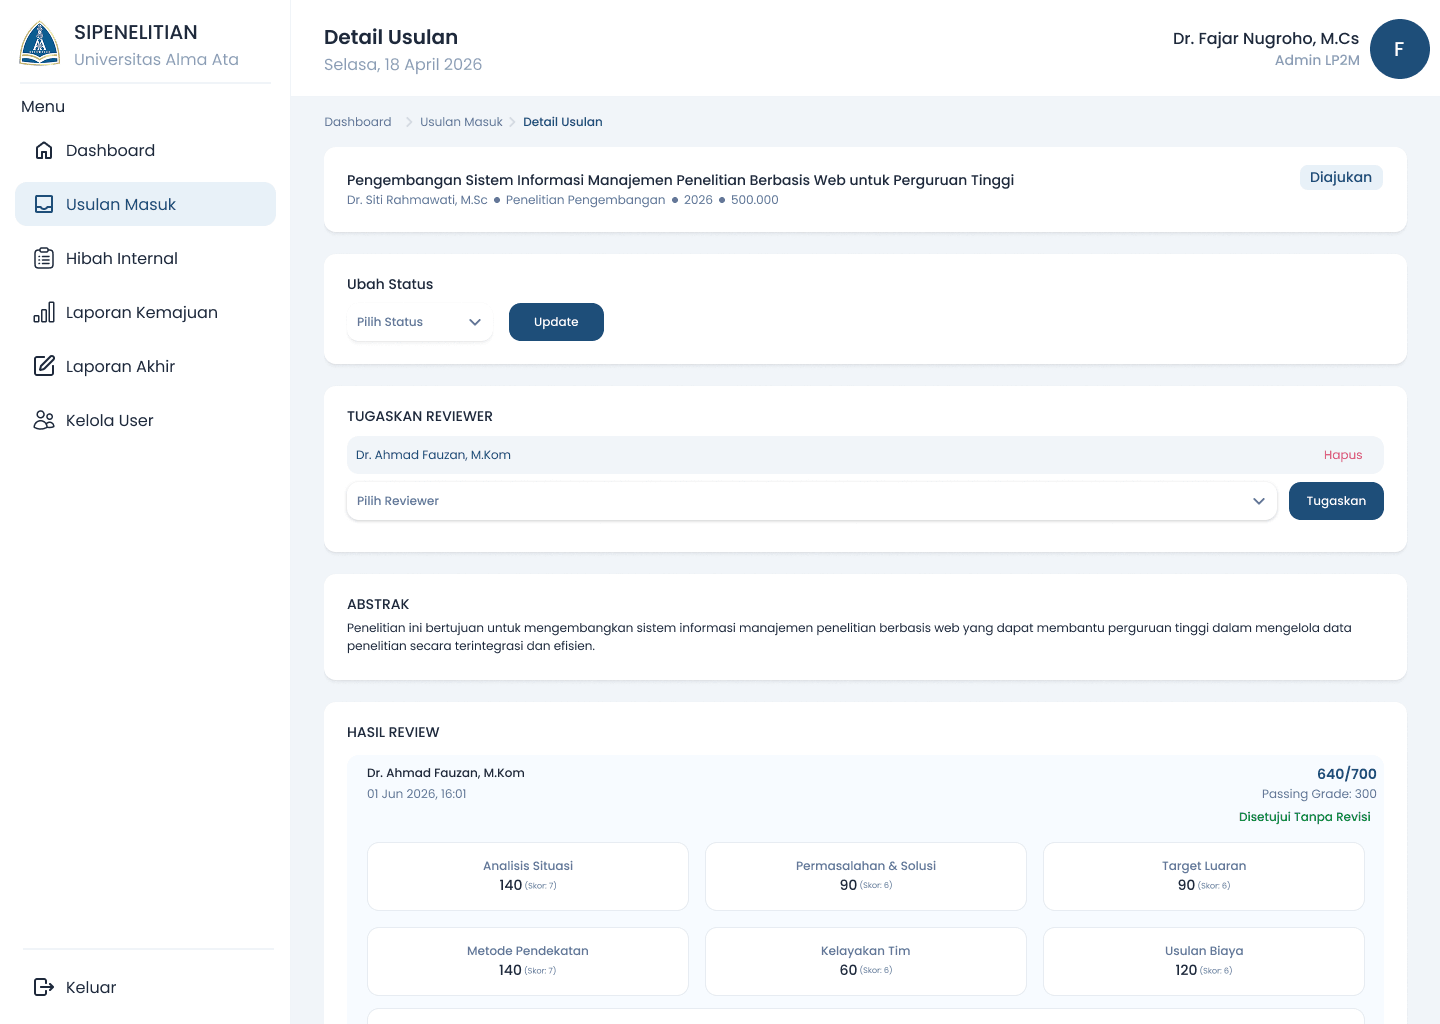
- Status changes have to be possible directly from the proposal detail page, not from a separate menu.
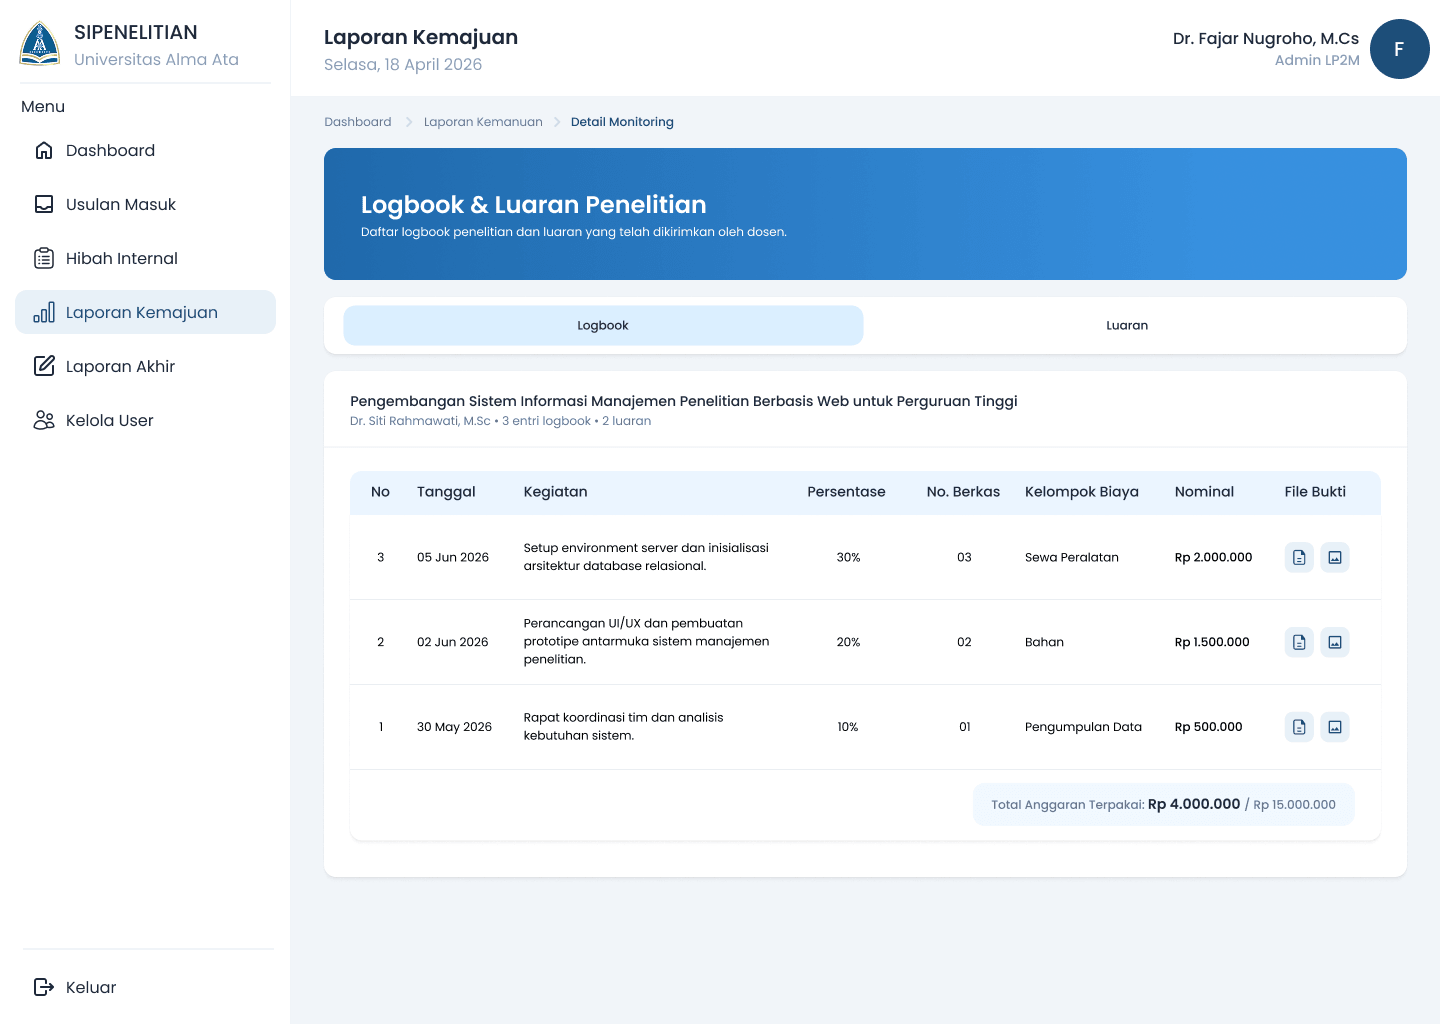
- Logbooks and research outputs are attached to the progress report so the activity history never separates from its report.
04. Define & Strategy
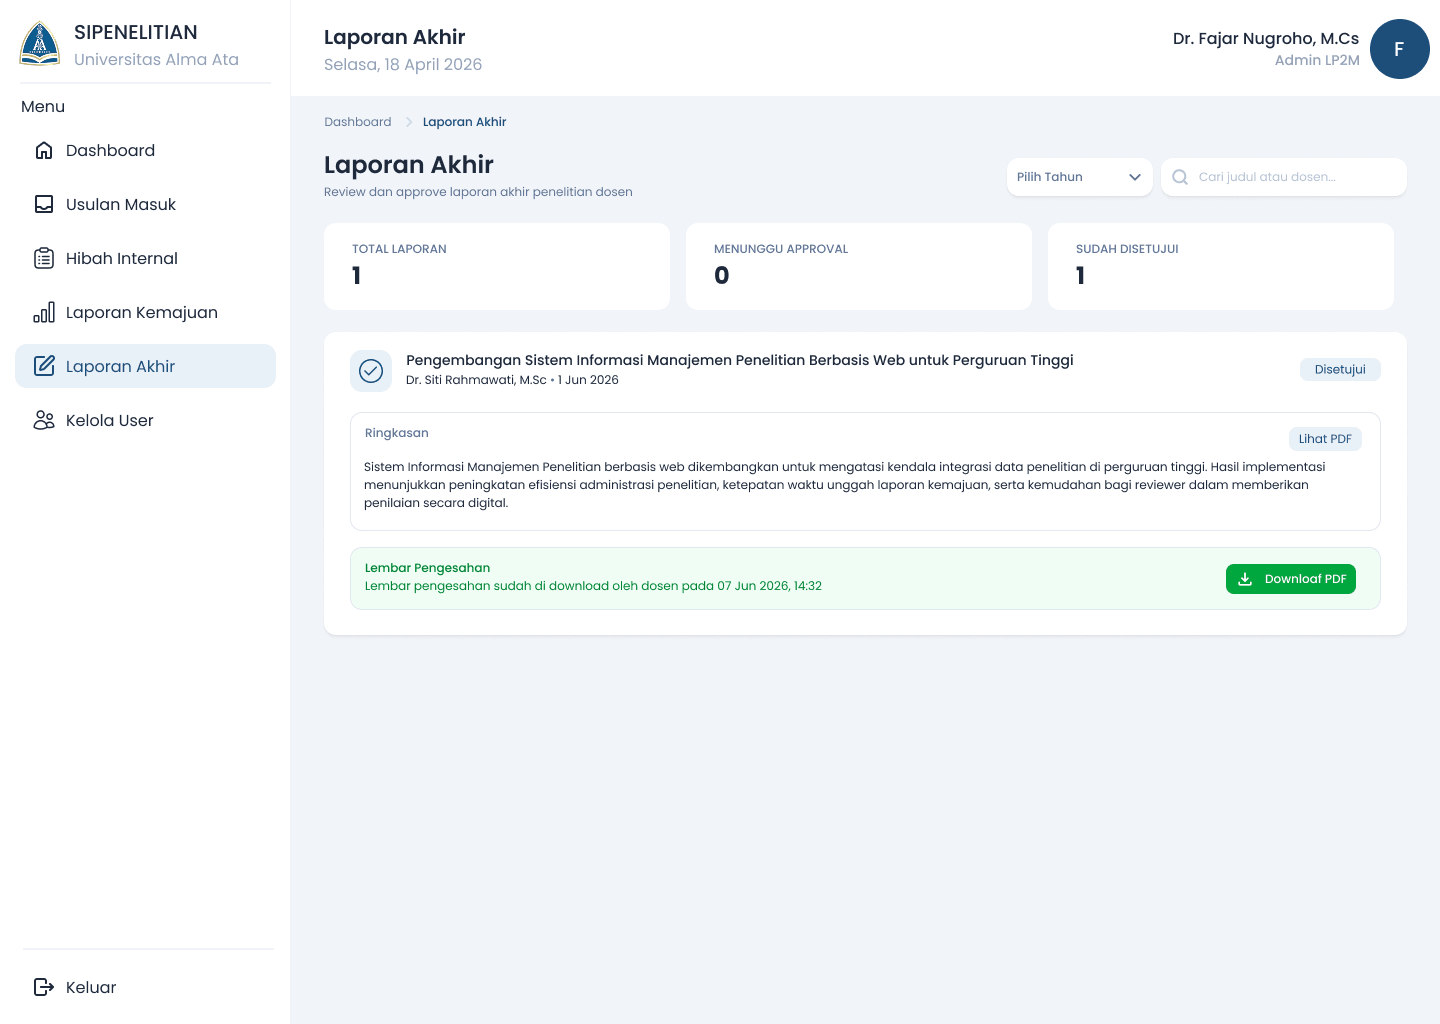
The roles are clearly separated. Lecturers submit proposals and upload reports; the LP2M admin verifies, changes status, and downloads approval files. Each gets its own sign-in page and navigation, sharing one table pattern so the admin never has to relearn a page.
05. Information Architecture & Flow
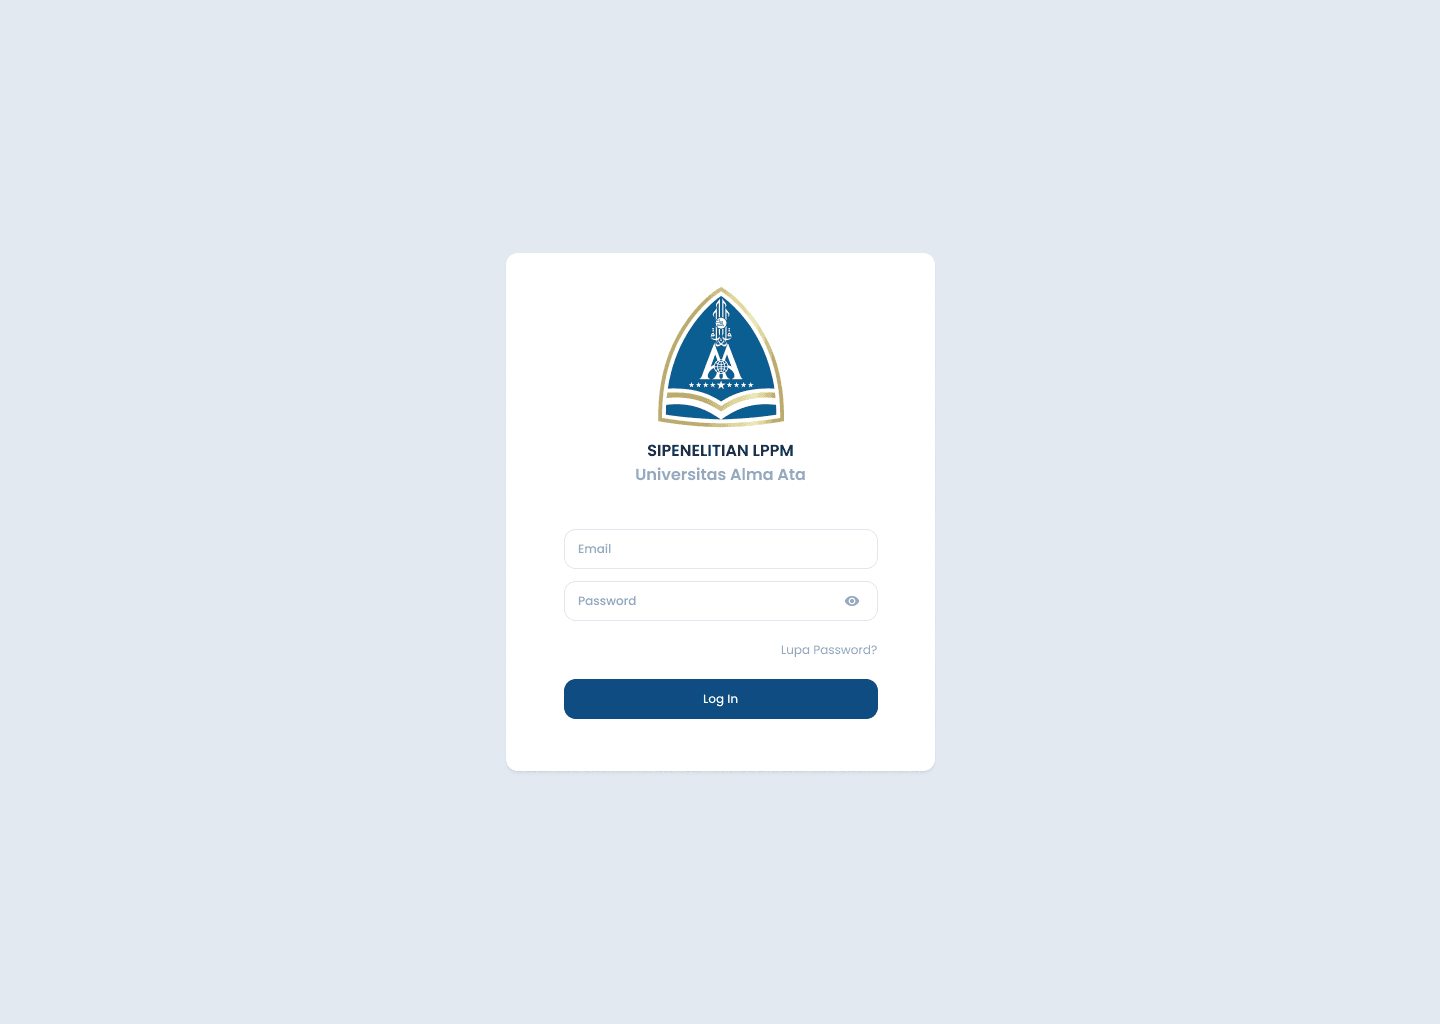
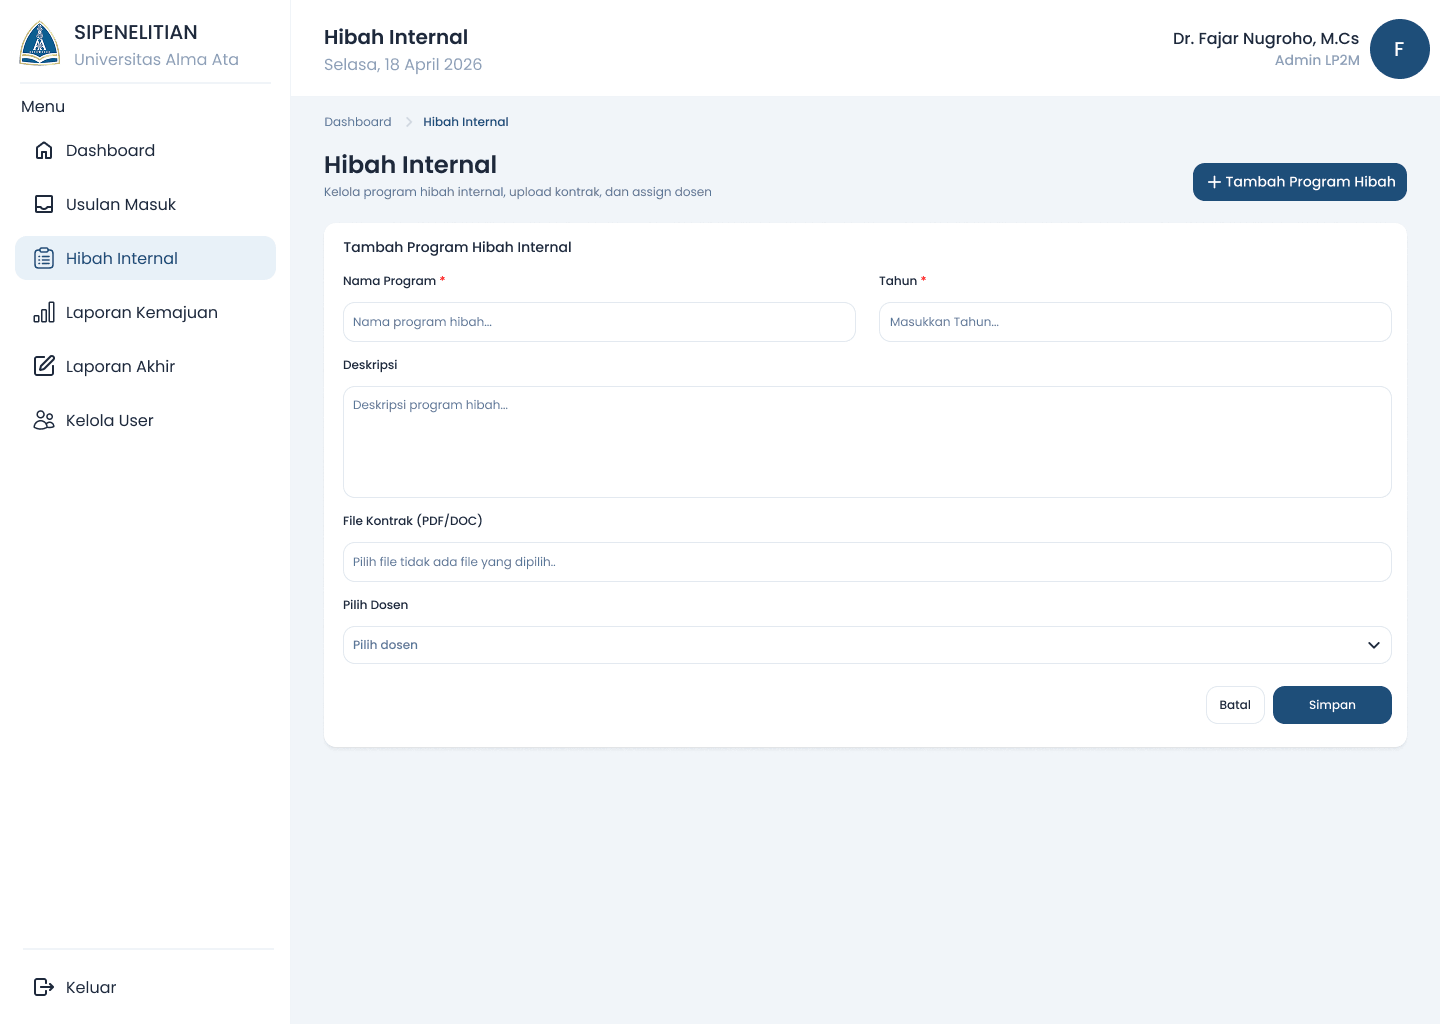
Login → Admin Dashboard → Internal Grants (add program) → Incoming Proposals (all years) → Proposal Detail (status change) → Progress Reports (monitoring & logbook) → Final Reports (download approval sheet) → Manage Users. Admin flow: sign in → read the dashboard summary → review incoming proposals → open detail → update status. Lecturer flow: sign in → submit a proposal → fill in the logbook → upload the final report.
06. Wireframing & UI Design
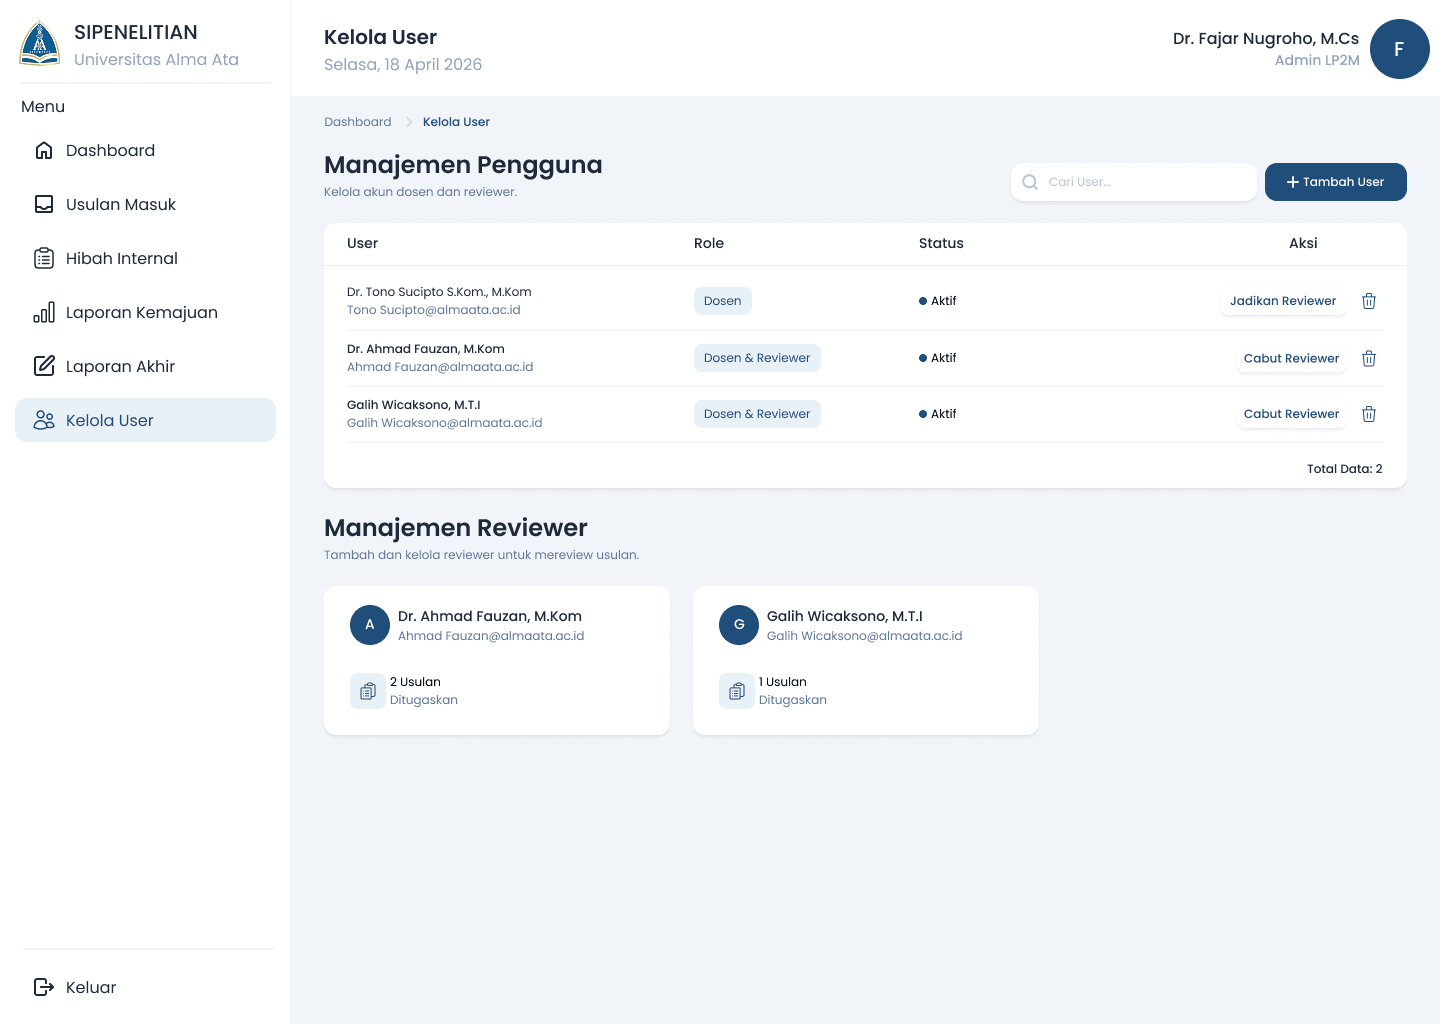
The interface was designed in Figma as a desktop dashboard: data tables with status markers, a detail panel beside the list, and internal-grant and manage-users forms that follow the same table pattern. Status colours are applied consistently to distinguish each stage of a proposal.
07. Usability Testing & Iteration
Usability testing ran with 20 lecturers. It produced a System Usability Scale (SUS) score of 76.75 — “Acceptable” for acceptability and “Good” for usability.
08. Final Result & Impact
The prototype covers eight core screens: login, admin dashboard, add internal grant program, all-years proposal list, proposal detail with status change, progress-report monitoring detail with logbook, final report with approval-sheet download, and manage users.
09. Personal Reflection & Learnings
In administrative systems, clear status matters more than visual polish. What got retested most was the placement of status and of the status-change button.